
Indoor Air Quality (IAQ) Report
in Ottawa
Breathe easy with a complete environmental analysis of your home. We measure
radon, chemicals (VOCs), moisture, and allergens, delivering a professional action
plan for your family's health.
Total Environmental Safety
Why Just Testing Radon Isn't Enough
Because Ottawa winters demand tightly sealed, energy-efficient homes, natural ventilation can suffer. While trapping heat inside keeps your energy bills low, it also traps sub-slab radon gas, household chemicals, and humidity. High carbon dioxide and VOCs cause recurring headaches and morning brain fog, while elevated moisture fuels active mold spores.
Winter Draft Inversion
When doors stay closed, stack-effect pressure pulls chemicals and radioactive radon directly into your lower living rooms.
Volatile Organic Chemical Buildup
Modern home materials and paints continuously off-gas VOCs that can irritate respiratory pathways.
The Humidity Sweet Spot
In Ottawa, indoor humidity above 50% triggers mold spore germination, while levels below 30% dry and inflame sinuses.
Carbon Dioxide Trap
Poor mechanical fresh air exchange leads to CO2 spikes in bedrooms overnight, affecting deep REM sleep cycles.
HOME POLLUTION TRAP
How Air Stagnates
Soil Slab Gas Entry Points
Radon gas rises from bedrock fissures into basements.
VOCs Chemical Off-Gassing
Paints, sealants, carpets emitting complex chemical vapors.
H2O Trapped Excess Humidity
Sump basins and bathroom moisture seeding mold risks.
Full Spectrum Diagnostics
8 Environmental Parameters We Measure
Our advanced multi-sensor arrays monitor home conditions
continuously, capturing microscopic chemical fluctuations.
Radon Gas (Rn)
The invisible soil carcinogen. Standard continuous digital monitoring tracks long-term risk baselines in lowest living areas.
Volatile Organic Compounds
Chemical vapors emitted from house paints, composite woods, aerosols, and household cleaners that impact cognitive fatigue.
Carbon Monoxide (CO)
The silent combustion hazard. Checking gas furnaces, fireplace sealing, and utility vents to guarantee absolute peace of mind.
Relative Humidity (RH)
Keeping moisture between 30% and 50% to inhibit both mold spores germination and structural wood rot issues.
Carbon Dioxide (CO2)
The primary ventilation indicator. Unbalanced levels cause morning brain fog, heavy headaches, and general study lethargy.
Temperature Variance
Mapping heat gradients between crawlspaces, basement levels, and active bedrooms to evaluate thermal balance flaws.
Allergen Particulates (PM2.5)
Airborne dust debris, pollen fibers, and microscopic pet dander particles that trigger asthma symptoms.
HRV/ERV Airflow Balance
Validating that fresh-air mechanical exchange ventilators are operating correctly and pressure is normalized.
Advanced Analytical Tools
Hourly Sensor Readings & Interactive Analytics
We replace guesswork with continuous hourly charts
showing your actual indoor air quality trends.
Hourly VOC & CO2 Fluctuations Over 48 Hours
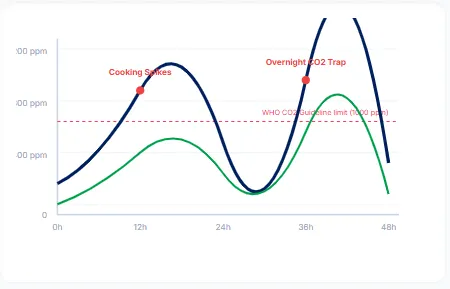
Trapped CO2 Levels
Volatile Organic Chemical (VOC) Levels
DATA-DRIVEN REPORTS
Our Professional Audit Standards
Continuous Air Profile Tracking
Instead of a single snapshot, we track your environment's breathing safety hourly over two days to observe living routines.Detailed Chemical Mapping
We isolate volatile organic vapors from everyday cleansers, cosmetics, and flooring adhesives.Thermal and Humidity Correlation
Observing temperature fluctuations in drafty areas to detect condensation points where mold spores easily grow.Direct HRV Diagnostics Review
Our technicians measure the actual static airflow and duct conditions of your Heat Recovery Ventilator.
Integrated Workflow
The 4-Step IAQ Report Audit
Day 1
1. Device Placement
A certified technician places digital air diagnostic arrays in key rooms, operating silently to sample air hourly.
48 Hours
2. Passive Monitoring
Our specialized lab sensors continuously track chemical, radiological, and environmental factors with no disruption to your day.
Day 3
3. Diagnostic Analysis
We fetch the array, compile the digital data logs, and cross-reference results with Health Canada and WHO guidelines.
Report Sent
4. Actionable Delivery
You receive the finished, high-readability PDF report detailing every pollutant level alongside a step-by-step action plan.
Clear Presentation
What Is Included In Your Air Quality Report?
Our professional PDF report translates complex environmental data into a clear action plan. We help you make logical, budgeted improvements to optimize your home.
Full-Spectrum Measurement Charts
Color-coded continuous data logs showing how VOCs, CO2, and radon fluctuate in your home across the full 48-hour testing cycle.
Ventilation Integrity Assessment
An objective diagnostic audit of your Heat Recovery Ventilator (HRV) filter conditions, fresh air supply rates, and local exhaust ducts.
Allergen & Mold Proximity Maps
Physical spot inspections in your cellar, kitchen, and bathroom to identify active dampness zones supporting mold growth.
Custom Environmental Action Plan
Clear, logical recommendations to optimize your home. This includes filter specifications, moisture targets, and mechanical adjustments.
AUDIT BRIEF DELIVERABLES
Sample Audit Layouts
INDOOR AIR REPORT
Page 1 of 8
Continuous Chemical Log: Total VOCs
Exposure: 180 ppb
Average value: Healthy
✓ Healthy Baseline Verified
📑 Deliverables include: A comprehensive PDF report with data charts and localized actions.
International Health Guidelines
Relying on Certified Air Standards
We align our air quality audits with the gold-standard
parameters set by leading national and global health organizations.
Health Canada Guideline
Residential Exposure Guidelines
Establishes exposure baselines for carbon monoxide, formaldehyde, and radon in Canadian residences.
WHO Indoor Air Quality Guidelines
WHO Indoor Air Quality Guidelines
Defines strict international standards for volatile chemicals and fine particulate matter to protect respiratory health.
ASHRAE Standard 62.2
Mechanical Ventilation Code
Defines necessary outdoor fresh air supply rates for residential properties to effectively mitigate organic gases and CO2 spikes.
Frequently Asked Questions
Indoor Air Quality Report FAQ
What makes an Indoor Air Quality Report different from standard radon testing?
While our standard radon testing focuses exclusively on tracking radioactive radon gas, the Indoor Air Quality Report is a holistic environmental audit. It analyzes total residential breathing safety, tracking radon alongside carbon dioxide, volatile organic compounds (VOCs), relative humidity, airborne allergens, temperature distribution, and mechanical ventilation efficiency.
How long does the air quality monitoring array need to stay in my home?
Our certified diagnostic monitoring array stays in your primary living space for a continuous 48-hour cycle. This short-term baseline captures standard daily activity, cooking habits, and overnight heating or cooling cycles to record real-world exposure levels.
Are the air monitoring sensors loud or disruptive to my daily routine?
Not at all. The professional air quality sensors we use are completely silent, compact, and require no special adjustments to your household routine. They simply sit on a table or shelf in your main living room or basement, measuring air currents passively.
What are some common sources of high Volatile Organic Compounds (VOCs) in Ottawa homes?
VOCs are chemical vapors released from common building materials and household items. Major sources include fresh paints, synthetic carpets, pressed wood cabinets, air fresheners, personal cosmetics, laundry chemicals, and household solvents. Tight, high-efficiency winter sealing in local homes often traps these chemical vapors inside.
Will this air quality report tell me if I have active mold growth in my house?
Yes. In addition to measuring relative humidity levels that foster mold growth, our technician performs a physical inspection of typical humidity hot spots (sump pits, cold rooms, basement walls). The report notes structural risks and dampness issues that support mold spores.
What is the starting cost of an Indoor Air Quality Report in Ottawa?
Our complete Indoor Air Quality Report packages start at a flat rate of $295. This includes diagnostic device deployment, continuous 48-hour tracking, certified lab review, and the creation of your custom action blueprint.

We Mitigate Radon is a collaborative team of licensed and highly experienced professionals specializing in HVAC systems, mechanical engineering, climate control, and indoor air quality.


ACCREDITATIONS
TSSA-licensed
certified indoor air quality specialists with more than 26 years of experience serving Ottawa and the surrounding region.
100% Guaranteed
Mitigation systems guaranteed to lower levels below Health Canada guide limits.
© 2026 We Mitigate Radon. All rights reserved.
All systems architected as per EPA & Health Canada active environmental guidelines.